“What a piece of work is a Spreadsheet!”
“How express and admirable, in form and moving. In Action, How like an angel. The beauty of software, the paragon of interfaces. What a piece of work is a Spreadsheet!…”. What else could Shakespeare say? It would have been compelling for him to see the ease, capability and penetration of the spreadsheet software. About ease, Nothing more complex than a grid and an infinite one in its form. And, You can scribble anywhere. So simple, yet so capable! Select two columns and you have a pivot table! Click a button, and you can run a regression and do some forecasting. The coming of AI into the spreadsheet is making it more dramatic. In light of its ease and its power, it is no wonder how penetrated its use is from school children to the business executives. Everyone uses it. I am an engineer, and I love it.
Sure, we cannot probably fit a million rows into a spreadsheet. We probably can, but it is going to be unwieldy. This is exactly where databases shine. While storing humongous amounts of data, aka big data, they can easily crunch and retrieve a preview or whole of that data. They can even spread that compute and storage across a vastly distributed cluster of cheap computers. Although the data access layer (SQL) for the databases is great, it is by no means comparable to the flexibility of a spreadsheet. Herein lies the great tussle between a great store and a great powerhouse for analysis. What if there was a cross? A spreadsheet that can instantly pull data from a big database. We call it an Instant Spreadsheet, a paradox that is seemingly unachievable.
While an instant spreadsheet is physically impossible, the proportion of use-cases with the magnitude of data that a spreadsheet can hold, is much larger. I would bet 99%. Arguably, once the data is pulled into a spreadsheet from a datastore, the single source of truth does not exist anymore. And the truth starts diverging. This factor needs to be reconciled with. Notwithstanding the 1% of big data use-cases and the divergence of truth, we understand the usefulness of the spreadsheet and the human mastery over it and are, therefore, launching a “Data Platform for Spreadsheets”, valmi.io .
For the spreadsheet to be useful, it needs Data. We gather, aka ETL, data from various business sources. In the eCommerce domain, Store fronts, such as Shopify and Amazon Seller Central, and Ad platforms, such as Meta and Google Ads, provide vital data for businesses to grow.
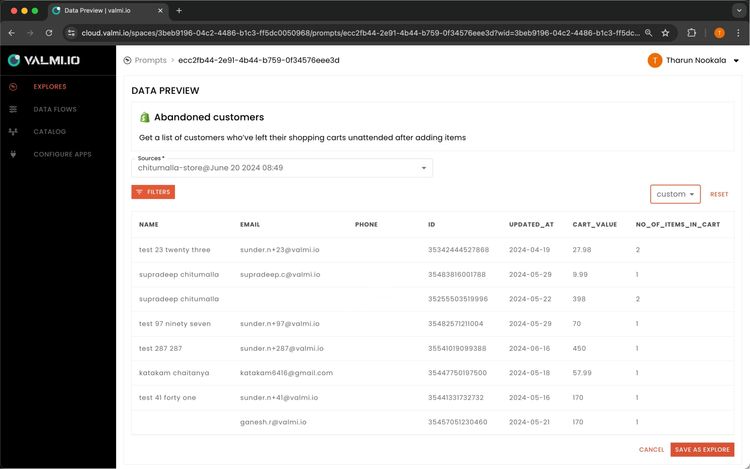
Data is raw, unformatted when pulled from the sources. Ugly! To make sense of it, it needs to be prepared, aka transformed to fit business purposes. We, at valmi.io , prepare this data for business consumption and allow the user to prompt for it. Pre-baked prompts exist for now. Think, for instance, Average order value every month for a period of, let’s say, two years. There are many prompt boxes. In the future, We will add Natural language to creatively prompt for the data.
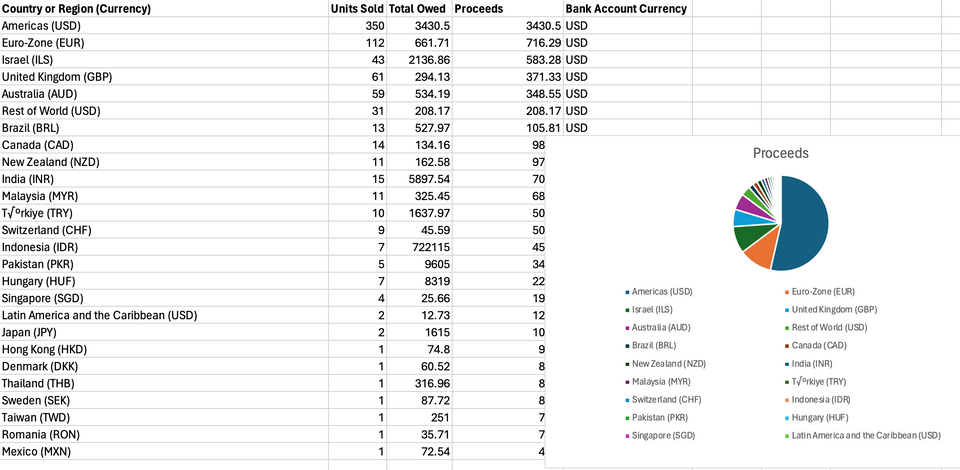
Once you are happy with filtering and previewing the data for your prompt, you can just create an Explore, which is a spreadsheet. The data is at your disposal in the spreadsheet, ready to be analyzed, graphed, shared and collaborated with all of your team. This feat we achieved without the help of engineering and with a lot of cost and time savings. The next most important step is to Operationalize this data, aka reverse ETL. This step automates data load into the spreadsheet or it can push data out of it periodically to many other tools to update, for instance, ad campaigns in Facebook Ads, or inventory in Shopify.
There is one hiccup in all of this. Spreadsheets start piling up once we get so used to valmi.io to move data in and out of spreadsheets. We would still like to have a central place to view our metrics and KPIs, instead of their being buried in a spreadsheet somewhere. In addition, we would like to drill down into the data powering those metrics, ideally in a spreadsheet. We are adding these features next. With the data comes AI alive. We are deliberating how predictions, such as customer churn risk, and lift in profitability with a discount, should be made available out of the box.
With this launch, we have added a few eCommerce connectors for Shopify and Ad platforms. Additional features, and more connectors are on the way. Please reach out for specific connectors in eCommerce, finance, and others. Think data for spreadsheets, think valmi.io .