


When it comes to quick data analysis, Google Sheets reigns supreme. It is easy to use and it is free. It is also easy to share with your team. You can use it to track your KPIs. It has its share of fans and we are going to show you how to use it to track KPIs.
Loading data into Google sheets through valmi.io is a trivial three step process. First, you configure the Google Sheets integration. Second, you add your production database as a warehouse. Finally, you configure a sync to connect the two.
In the following video, I will show you a quick demo of how to set up a sync to load data into Google Sheets. The sample data in the warehouse has a list of users with some interesting fields such as `aggregated_total_revenue`, `number_of_daily_opens`. We will load this data into Google Sheets and use it to track our KPIs.
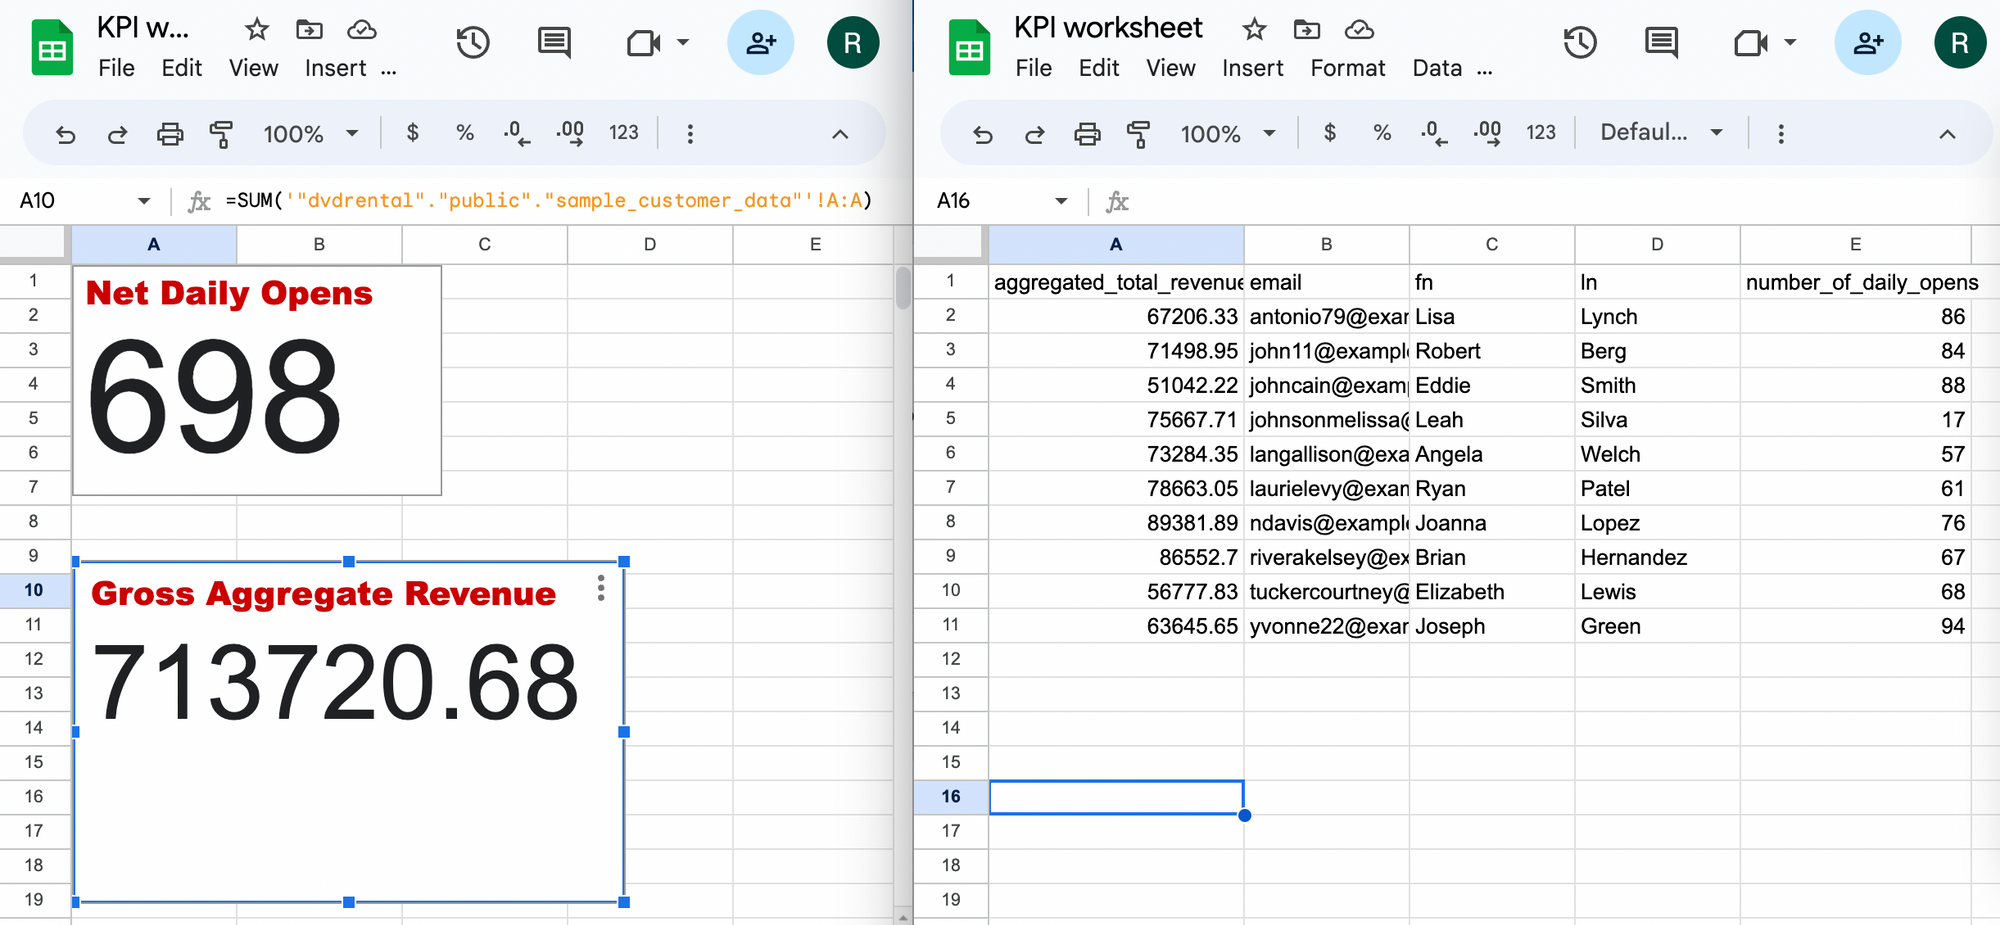
The data is loaded into the Google Sheet. We have also created two KPI metrics - Gross Aggregated Revenue and Net Daily Opens. The loaded Google Sheet with KPI display is shown below.
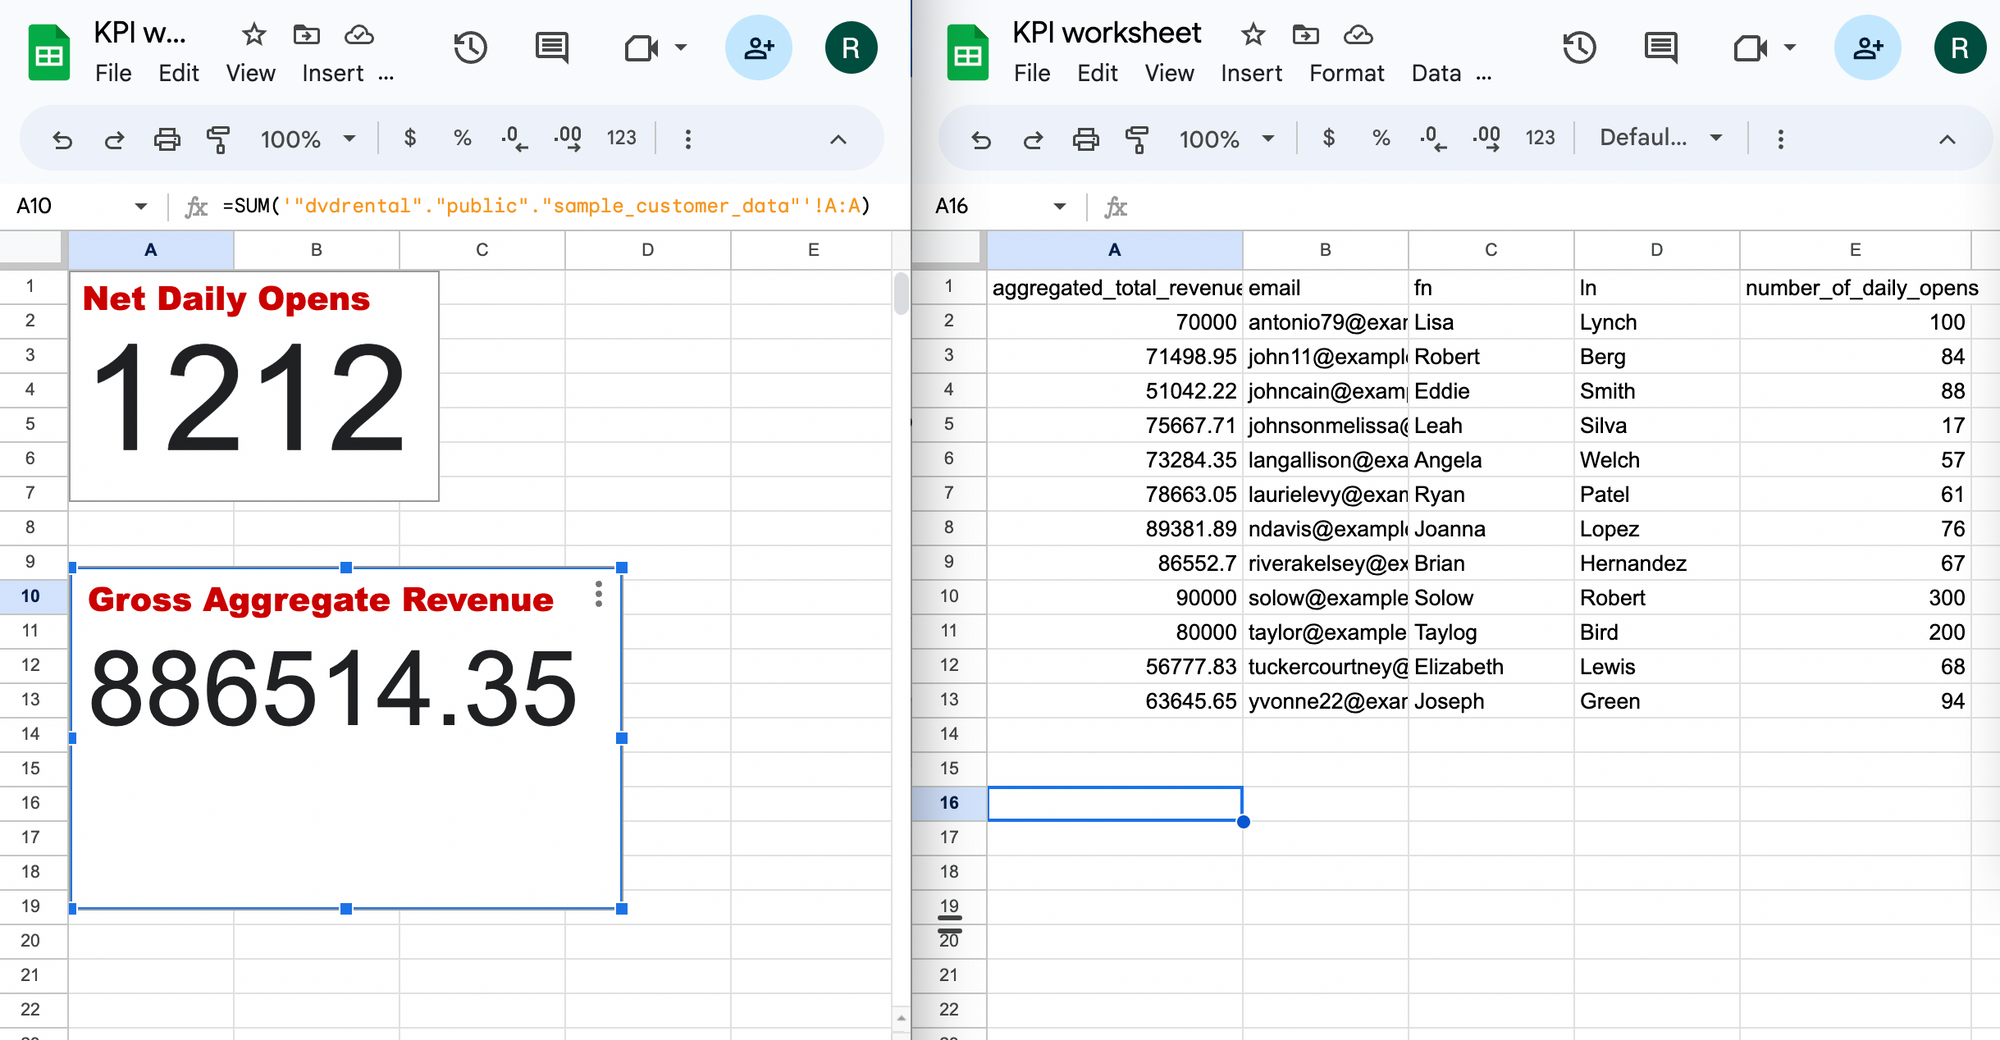
Next, we have updated the data on the warehouse for the purpose of demonstration. We have added 2 new rows and changed 1 row. The changed data points are displayed below.
|
FIRST NAME |
LAST NAME |
|
AGGREGATED TOTAL REVENUE |
NUMBER OF DAILY OPENS |
|
Taylog |
Bird |
taylor@example.net |
80000 |
200 |
|
Lisa |
Lynch |
antonio79@example.net |
70000 |
100 |
|
Solow |
Robert |
solow@example.net |
90000 |
300 |
When the next sync ran, the KPIs have changed accordingly. The following picture confirms it.
valmi.io Open Source reverse ETL can activate data in many other use-cases. Please enable your organisation with reverse-ETL by simply deploying it from github. You can look at a sync live here. Alternatively, you can schedule a sync at cloud.valmi.io. Please contact us if you are looking for any information by joining our community on Slack. We are adding new features to make the platform more robust.